

About This Station
This site is powered by a Davis Vantage Pro2 weather station. The data is collected every 2 seconds and the site is updated constantly. This site and its data is collected using Weather Display Software. The station is comprised of an anemometer, a rain gauge and thermo-hydro sensors situated in optimal positions for highest accuracy possible.
About Tauranga
Tauranga is the most populous city in the Bay of Plenty region, situated on the East Coast of the North Island of New Zealand. It was settled by Europeans in the early 19th century and is now is the centre of the sixth largest urban area in New Zealand, with an urban population of 118,200 (June 2009 estimate).
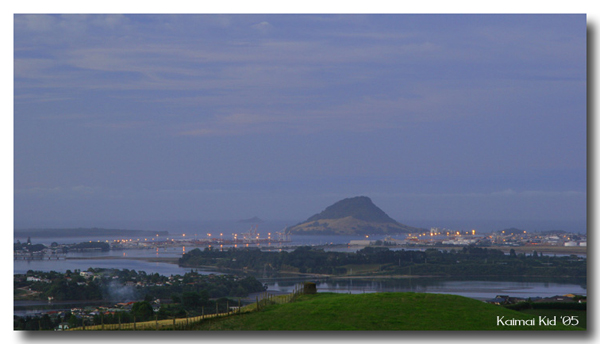
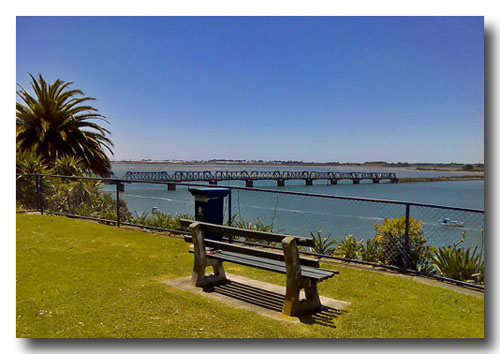
The city lies in the north-western corner of the Bay of Plenty, on the south-eastern edge of the Tauranga Harbour. The city expands over an area of 168 square kilometres (65 sq mi), and encompases the communities of (west to east) Bethlehem, Matua, Otumoetai, Greerton, central Tauranga, Maungatapu, Welcome Bay, Mount Maunganui, Bayfair and Papamoa . Tauranga is located around a large harbour that extends along the western Bay of Plenty, and is protected by Matakana Island and the extinct volcano of Mauao. Situated along a faultline, Tauranga and the Bay of Plenty experience infrequent seismic activity, and there are a few volcanoes around the area (mainly dormant). The most notable of these are White Island and Mauao (Mount Maunganui), nicknamed "The Mount" by locals).
Due to its sheltered position on the east coast, Tauranga enjoys a warm, dry climate. This has made it a popular location to retire to. During the summer months the population swells as the holidaymakers descend on the city, especially along the popular white coastal surf beaches from Mount Maunganui to Papamoa.
| Month | Jan | Feb | Mar | Apr | May | Jun | Jul | Aug | Sep | Oct | Nov | Dec | Year |
|---|---|---|---|---|---|---|---|---|---|---|---|---|---|
| Average high °C (°F) | 23.9 (75) |
23.8 (75) |
22.3 (72) |
19.9 (68) |
17.1 (63) |
14.9 (59) |
14.3 (58) |
14.9 (59) |
16.3 (61) |
18 (64) |
20 (68) |
21.9 (71) |
18.9 (66) |
| Average low °C (°F) | 14.5 (58) |
14.7 (58) |
13.5 (56) |
10.9 (52) |
7.9 (46) |
6 (43) |
5.2 (41) |
6.1 (43) |
7.8 (46) |
9.3 (49) |
11.3 (52) |
13.1 (56) |
10 (50) |
| Precipitation mm (inches) | 74 (2.91) |
78 (3.07) |
128 (5.04) |
105 (4.13) |
91 (3.58) |
128 (5.04) |
122 (4.8) |
115 (4.53) |
104 (4.09) |
94 (3.7) |
85 (3.35) |
87 (3.43) |
1,198 (47.17) |
| Source: NIWA Climate Data 1971 2000 | |||||||||||||
About This Website
This site is a template design by CarterLake.org with PHP conversion by Saratoga-Weather.org.
Special thanks go to Kevin Reed at TNET Weather for his work on the original Carterlake templates, and his design for the common website PHP management.
Special thanks to Mike Challis of Long Beach WA for his wind-rose generator, Theme Switcher and CSS styling help with these templates.
Special thanks go to Ken True of Saratoga-Weather.org for the AJAX conditions display, dashboard and integration of the TNET Weather common PHP site design for this site.
Template is originally based on Designs by Haran.
Thermometer graphic courtesy of Bashewa Weather (adapted from Saratoga Weather)
Cloud height graphic courtesy of Bashewa Weather
Weather Icons/images courtesy of Matangi Weather
This template is XHTML 1.0 compliant. Validate the XHTML and CSS of this page.

Welcome Bay Weather Cam was firstly possible due to the kind donation of a camera from |
|

|
|
| Security Systems, Alarm Systems, CCTV cameras, Portable CCTV Camera Recorder, PAT Testing, Em3 gate Motors, Gate Openers | |
SPECTEC ...... SPECIALIZED TECHNOLOGIES NZ LTD - PH (07) 5788900 24 Hrs |
|